Have you spent much time thinking about your total tax burden? Not just state and local income tax but the entirety of your annual tax burden including government fees, tolls, sales tax, the full gamut.
Think about it, how much of the compensation for your daily toil and pain for an entire year, 52 weeks, 2080 hours, goes to something other than savings, mortgage, food, car payment, etc.? I believe many of you would be surprised if you were to truly compile the information honestly.
Up until recently where you live in the United States made little difference relative to Federal income tax. With recent Federal tax law changes, which state you reside in makes a material difference. Tax payers in states with high income and property taxes will have a rude awakening in 2018.
Regardless, each state presents a different total tax burden profile. I put together a table of what I estimated to be a few high tax states, a few median and a few low tax states.
The primary, commonly found factors in a state’s profile are income tax (some states don’t have one!), property tax and sales tax. But other forms of “taxation”, ones that are becoming more prevalent and even preferred by the executive branch and legislators, are users fees.
More of the new highway construction, as well as refreshing of existing road systems, have automated transponder/receiver toll systems. Fees for driver’s license, vehicle registration, professional fees, permits, parking, hotel rooms, concert tickets, on and on etc., etc. And much of it going up at rate that can exceed inflation. Some vary by the day, hour or moment….depending on demand. Many are forms of taxation that do not require legislation nor a signature by a jurisdictional executive. Traditional tax increases always come with a high profile from the mainstream media and the tax paying public. “Fees” represent an EZ-Pass of taxation that no one ever talks about.
The Analysis
So, first and foremost, I am not a CPA. Regardless I do believe I have assembled a reasonably fair data set. I used several sources to compile the data. All sources are listed below. I believe the sources to be reasonably credible, but I am not asserting that I have done months of exhaustive research and scientific analysis. I would suggest that I may be missing some important factors that tax experts would bludgeon me with after reading this post. Granted, but I did put a few days into collecting the data from those sources and putting the reported amounts or percentages into a data set. The one data element unsubstantiated in any way, other than my perception of what is reasonable, is the “Fees” portion of the tax burden. I simply applied a .5% of AGI to each level of AGI. Which in some cases was a few hundred dollars and in the higher AGI ranges was in the thousands.
As a side note, another form of taxation, possibly replacing our current income-based system, may emerge as one that appears to make more sense; a consumption-based system. It would potentially be far more progressive if those who do not pay income tax today (due to their income levels) were exempted appropriately.
The Average American Household Income
The overall average household income was $61,372 in 2017 according to census.gov. However, the effects of this average income level can vary significantly depending on your household’s composition. For example, a single-person household earning $61,372 could have a completely different financial situation than a family of four or five with the same income.
The Elements
The States I chose to profile were Maryland, California, Connecticut, New York, Virginia, Texas, Florida, Alaska, Nevada, Illinois and Wyoming. Each representing a region of the country or a high population area, or both.
The AGI levels I chose were the following:
•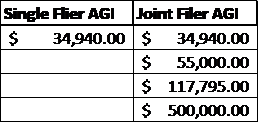
- Note on the AGI at $34,940.00 (after all deductions) – these households qualified for the Earned Income Tax Credit thus dramatically lower the Federal tax burden in my example.
• There is no real logic in them with the exception to the following:
– Obviously in all cases this is their taxable income after any qualifying deductions or credits.
– Single Filer $34,950 – this seemed to be a reasonable number for a young person. A new school teacher, a seasoned office worker or semi-skilled manufacturing role as just some examples. In this example it is someone with a single dependent child.
– Joint Filer $34,950 – similar to single filer but someone with an average family size
– Joint Filer $55,000 – possibly a joint filing couple with mortgage. Relatively close to US median income.
– Joint Filer $117,795 – A joint filing couple both with US median level incomes or a professional with a stay at home spouse among other possibilities.
– Joint Filer $500,000 – this is a true “one percenter” example and also maps to my earlier post about what is true wealth.
The Tax Elements
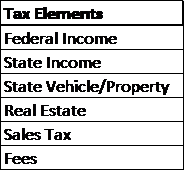
For Sales Tax my assumption for all AGIs was that 33% of the AGI represented disposable income used for purchases subject to Sales Tax.
The Findings*
As a reminder the intention of this post is to highlight a simple fact most of us do not think about very often if ever; what is the totality of my tax burden. It is intended to be a source of insight, not a collection of irrefutable facts in infinite detail gathered by PWC or KPMG. I have endeavored to be both accurate and fair. I do believe the insight is a useful lesson for when politicians ask for more (silly me, they don’t ask….they just take and hope you won’t boot them out next election) you can be mindful of just how much we give already. So let’s look at a few of the numbers I compiled.
Lower Than Average Household Income Examples
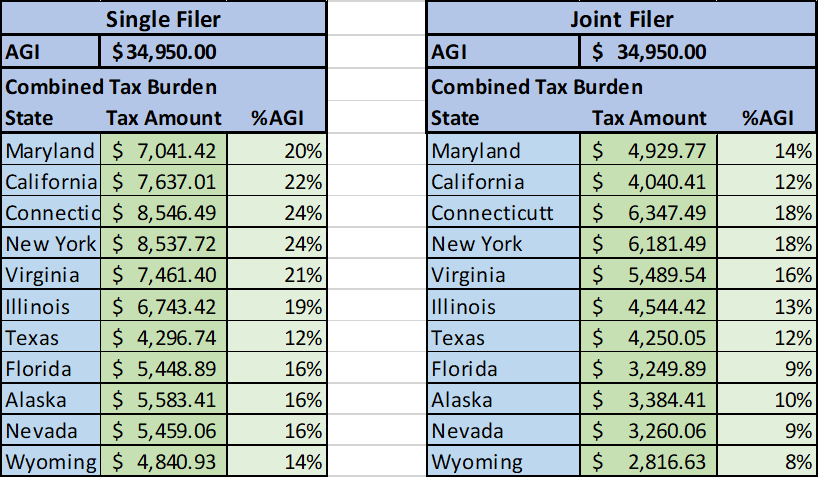
Figure: A
For this single filer AGI with one child hypothetical scenario, it is a heavy burden to be a sole taxpayer in this scenario especially in the high tax states of Connecticut, New York and California shown in Figure A . Upwards of 24%, about one quarter of the total taxable income for the year, goes to taxation of various forms. In New York and Connecticut this single filer would have to work from January 1st to the end of March just to cover the tax burden.
For the Joint filers in the hypothetical scenario in Figure A, as a family of four they qualified for a larger EITC tax credit. Which means they both only work until early March each year before a dollar generated by their toil reaches their pocketbook. Even with this assistance it’s a tough go for a family of four with this income level. I have not researched this but there must be other programmatic support available for both scenarios in Figure A.
Hidden Taxes
This does not include less tangible forms like gasoline tax among others. For example, in Virginia the state totally controls the sales of alcoholic beverages through state-owned retail outlets. Virginia has increased prices to be the highest among neighboring states as they not only collect the sales tax but also capture the profit margin between cost and sale which then goes into the state’s general tax fund. A state-run monopoly that can increase prices at will with no scrutiny.
Then there is the case of lottery systems and other forms of gambling that the states control, and profit from mightily, that represent very repressive forms of taxation. Even with my feeble attempt to associate all forms of taxation to an individual taxpayer, there isn’t a reasonable path to bring the alcoholic beverage profit tax or gambling participation to an individual level but, it is TAXATION none the less.
Near or Higher Than Average Household Income Examples
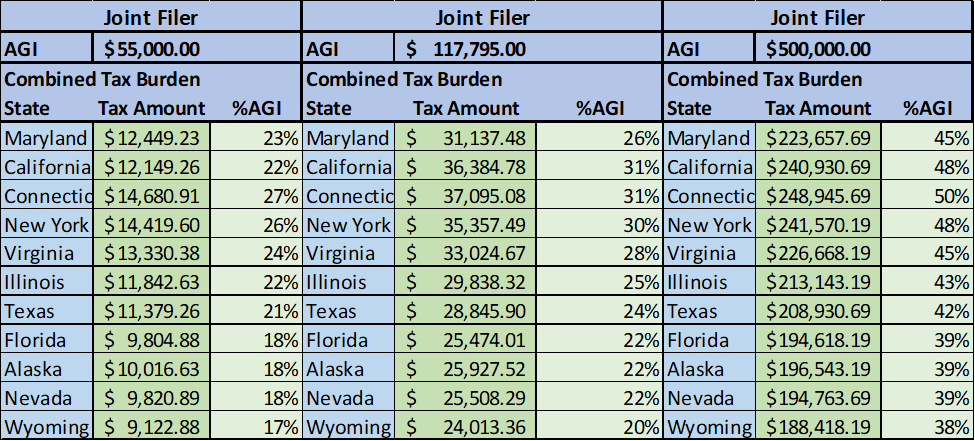
Figure: B
For the $55,000 AGI, very close to the US Household Median, Connecticut and New York residents have well over 25% of this modest income level wrest from their hands before they buy one loaf of bread. For the $117,795 AGI, representing approximately the top 20% of households in the United States, households in high tax states like California, Connecticut and New York see nearly one third of their income go to the tax collectors.
For the true “one percenters” at the $500,000 AGI level, the burden in high tax states like California, Connecticut and New York see nearly half of their taxable income going to the tax collector. In real numbers we are talking about nearly a quarter of a million dollars for their tax bill each year! This is not a judgmental statement about whether this is fair but 50% is certainly a socialist state level of taxation. These are households with possibly one or two high earning professionals, possibly a successful entrepreneur, or a household with enough family wealth to produce this level of income from investments, or, possibly some mix of these and other elements.
Summary
My primary point in all this is, when is enough…enough? Debates rage daily about the federal deficit spending dilemma. The federal government, even with trillions in tax revenue (estimated to be $3.422 trillion dollars in 2019), adds to the deficit by hundreds of billions each year.
I have observed from credible sources that the total spend annually on social welfare programs alone in this country, both federal and state combined, is one trillion dollars. One trillion dollars, per year! Take the 40 million people (not just US citizens) the federal government states are in poverty in this country and share that one trillion dollars equally among them its $25,000 PER PERSON in government social programs spending. Unless my math is way off that’s $100,000 for a family of four. I am not naïve enough to believe all those dollars actually reach those in need. The system carries A LOT of overhead and administrative cost. Adding in fraud and waste, my SWAG is about half of those funds actually reach those in need. Still a substantial amount of aid per person. I have read that here in Virginia that if a family at the poverty level were to take advantage of all available programs the benefit would equal $50,000 per year.
When you take a look at the combined burden of all that the government takes from us each year, when is it enough? The truth is a rapidly growing economy offering more and better employment opportunity is a far better elixir for poverty than even more government programs.
Again, I state for the record, mine is not a scientific analysis. I am certain holes can be punched in it but I stand by its assertion that we are already burden enough by government cost, upwards of 50% of some income levels in high tax states. I hope you will give that some thought next time you vote.
*based on my limited knowledge and data collected. Not intended to be a definitive, exhaustive analysis of all the possible factors that could have affected the information provided.
Sources:
http://www.salestaxhandbook.com
https://www.fool.com/retirement/2016/10/30/heres-the-average-american-household-income-how-do.aspx
https://www.nerdwallet.com/blog/taxes/federal-income-tax-brackets/
https://www.irs.gov/statistics/soi-tax-stats-tax-stats-at-a-glance
https://taxfoundation.org/state-and-local-sales-tax-rates-in-2017/
http://www.tax-rates.org/taxtables/sales-tax-by-state
https://wallethub.com/edu/best-worst-states-to-be-a-taxpayer/2416/
https://smartasset.com/taxes/illinois-tax-calculator
https://www.acf.hhs.gov/css/resource/income-tax-credit-for-low-income-working-individuals
https://www.efile.com/tax-rate/federal-income-tax-rates/#2017
https://www.tax-brackets.org/marylandtaxtable
http://www.tax-rates.org/taxtables/income-tax-by-state
https://www.cato.org/publications/policy-analysis/american-welfare-state-how-we-spend-nearly-$1-trillion-year-fighting-poverty-fail
https://seekingalpha.com/article/4109731-united-states-income-brackets-percentiles-2017
https://en.wikipedia.org/wiki/Household_income_in_the_United_States
https://www.census.gov/library/publications/2018/demo/p60-263.html
https://en.wikipedia.org/wiki/Earned_income_tax_credit
https://www.thebalance.com/current-u-s-federal-government-tax-revenue-330576
